A very brief look into how reliably the mass media and scientific publications report from the battlefronts of Novel Coronavirus war.
Coronavirus in Florida
COVID-19 was undeniably the hottest news of 2020. It dominated media outlets, YouTube videos, blogs and social networks. From its early days, it has been weaponized and politicized by various interest groups. That’s nothing new – most situations which affect masses are usually used as vessels to try and deliver hidden agendas. The narrative on wars, economic downturns and natural disasters is, sadly, always dominated by ideological shouting games with hardly any air time left to discuss their inherent nature.
To show this phenomenon, we analyzed 6 months of COVID spread in Florida, with the earliest reported cases dating back to early March. The data was made publicly availably by the Florida Department of Health.
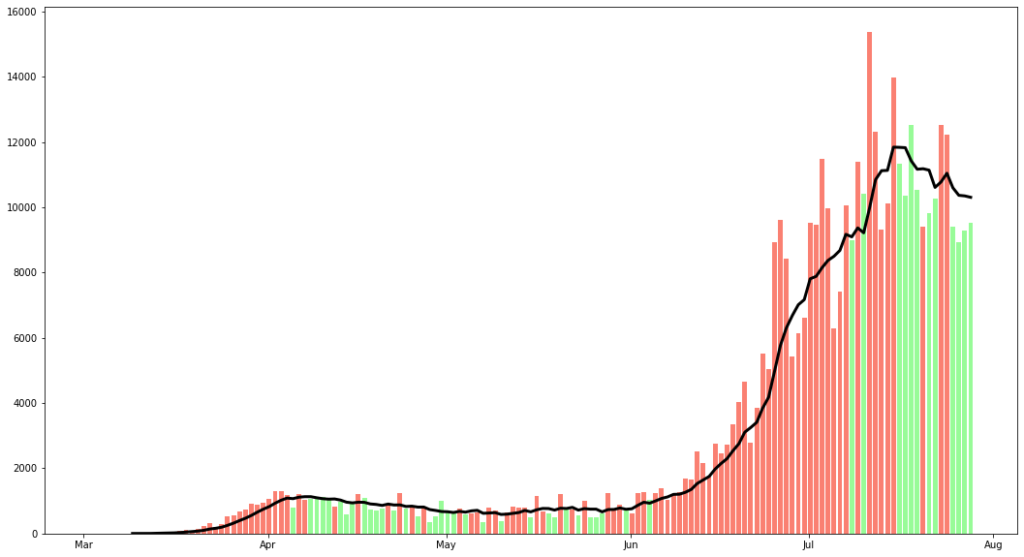
To even out daily reporting inconsistencies, we calculated a rolling 7-day average of new cases reported in our home state. On the chart above, these are represented by red and green bars – the latter showing a drop in said 7-day average.
As expected, we got clusters of green between April and May and starting with the second half of July. Those are the post-peak periods when the state experienced a decline in new cases. With those identified, we turned our attention to media outlets.
The Mass Media
First, we discarded the first 30 days. There are two reasons: 1) cases reporting was not fully established yet and as such the numbers ought not to be considered reliable, and 2) the media was in a panic frenzy mode dominated by uncertainty. With that said – and looking at our color coded chart – we would expect a U-shaped sentiment distribution, with the 6 weeks of June and July showing a rapid increase in new cases.
Starting with April 18, we analyzed up to 100 randomly chosen news pieces related to COVID (MSNBC, FOX, CNN, Bloomberg, et al.) and then used Natural Language Processing to determine their sentiment. Around 1% of our samples was analyzed manually to ensure that NLP scoring was accurate. The results are shown below:
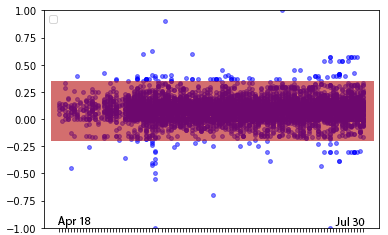
Sadly, no U-shape was to be found. There was no correlation whatsoever between the virus trends and sentiments of daily news articles. The 95th percentile area (highlighted red) remained stable throughout the whole period with each outlet sustaining the same narrative for most of the year. To steer away from politics, the trends of individual broadcasters were not shown on the chart.
Unfortunately, there is no way to escape the confirmation bias for an average viewer. While each outlet continues on with their own rhetoric, unaffected by the facts, the social divide widens and public dialogue becomes even more polarized.
The Academia
The mass media results are disappointing, but somewhat expected. It’s no secret that number one mission of broadcasters is to sell ads, and to do so they need an audience willing to consume their content. This task becomes more difficult if you challenge your viewer’s beliefs, therefore the best avenue is to tell people what they want to hear and sign them up on a 29.95 per month plan for a pair of sunglasses in the process.
Surely, the priorities are different in the world of renowned academic institutions. Since coronaviruses are nothing new, there are thousands (72 to be exact) of peer reviewed papers related to the subject. Conveniently, in an attempt to engage AI researchers, NIST put up a massive coronavirus dataset comprising of around 200,000 peer reviewed papers online for anyone to mess around with.
Those date back to the 1970s and represent the evolution of our understanding of this particular family of viruses. Rather than focus on the biological aspects of those papers (which are gooey, subject to random mutations and oh so non-digital), we performed a similar sentiment analysis. To get from 200 to 72 thousand, we removed all non-English or suspiciously sourced papers, as well as the duplicates.
Results are shown below:
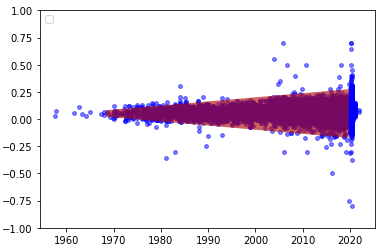
For the 95th percentile analysis we excluded 2020, because of obvious extreme nature of those samples. What we see is an increasing amplitude of sentiment.
While not immediately obvious to people outside the scientific community, the are reasons for this “cone of extremity“. After talking to some faculty at FSU, it became clear that it has mostly to do with research funding. As it becomes more and more challenging to receive sponsorship, scientist tend to exaggerate their (achieved and expected) outcomes in hope of standing out from the crowd and attracting the attention of someone willing to part with their money.
Go Big or Go Home
Both results are deeply troubling and show inherent flaws of our current free market economy – as it pertains to scientific news and research. As general population becomes more desensitized to a neutral narrative, it calls for severe arguments to be even noticed.
This is by no means a criticism of unregulated markets. Totalitarian regimes are not necessarily known for nurturing of scientific progress (see the story of a Russian botanist Nikolai Vavilov). Quite the opposite – I was lucky enough to be able to experience both a state sanctioned and commercial education – and the vast gap between those will never be bridged, due to inherently unfair nature of the former.
But it doesn’t mean we shouldn’t strive to obtain a compromise between commercial gains and well educated and informed societies. The challenge here is, such a drive must come from within: raw unobstructed information (whether scientific or news) must be considered a valuable product.
Highly processed news, just like food, should not be consumed in large quantities.
The NLP COVID analysis was a part of FSU program on Parallel and Distributed Computing. All opinions presented are solely my own.